求助用jfreechart画时序图问题!大神们帮帮忙!~
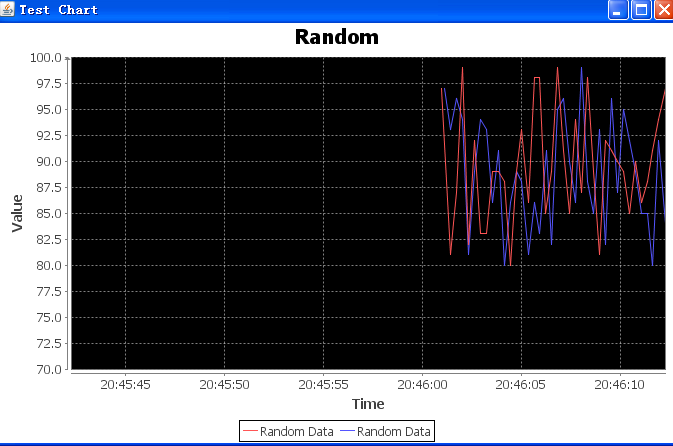
用jfreechart画的时序图,为什么起始位置是在最右边而不是在坐标轴的开始位置?怎么修改呢?
private static JFreeChart createChart(String chartContent,String title,String yaxisName){
//创建时序图对象
timeSeries1 = new TimeSeries(chartContent,Millisecond.class); //添加一条走势曲线
timeSeries2 = new TimeSeries(chartContent,Millisecond.class);
TimeSeriesCollection timeseriescollection = new TimeSeriesCollection();
timeseriescollection.addSeries(timeSeries1);
timeseriescollection.addSeries(timeSeries2);
JFreeChart jfreechart = ChartFactory.createTimeSeriesChart(title,"Time",yaxisName,timeseriescollection,true,true,false);
XYPlot xyplot = jfreechart.getXYPlot(); //将timeseriescollection中的坐标给到xyplot中
xyplot.setBackgroundPaint(Color.BLACK);
//纵坐标设定
ValueAxis valueaxis = xyplot.getDomainAxis();
//自动设置数据轴数据范围
valueaxis.setAutoRange(true);
//数据轴固定数据范围 30s
valueaxis.setFixedAutoRange(30000D);
// valueaxis.setLowerBound(10000);
//valueaxis.setUpperBound(90000);
//xyplot.setAxisOffset(new RectangleInsets(50.0, 0, 0, 50.0));
valueaxis = xyplot.getRangeAxis();
valueaxis.setRange(70D,100D);
valueaxis.setPositiveArrowVisible(true);
return jfreechart;
}
public void run()
{
while(true)
{
try
{
timeSeries1.add(new Millisecond(), randomNum());
timeSeries2.add(new Millisecond(), randomNum());
Thread.sleep(300);
}
catch (InterruptedException e) { }
}
}
private long randomNum()
{
//System.out.println((Math.random()*20+80));
return (long)(Math.random()*20+80);
} jfreechart 时序图 --------------------编程问答--------------------
 --------------------编程问答--------------------

补充:Java , Java相关