amCharts如何实现画2条Y线?
调用哪些属性?最好贴点代码,谢谢 --------------------编程问答-------------------- 多添加一个Series,绑定数据就行了foreach(DataRow dr in table.Rows)
{
Series[1].Points.AddXY(dr[i].ToString(),dr[j].ToString());
Series[2].Points.AddXY(dr[i].ToString(),dr[j].ToString());
}
dr[i].ToString(),dr[j].ToString() --------------------编程问答-------------------- 具体我也没试过 嘿嘿 --------------------编程问答-------------------- <?xml version="1.0" encoding="utf-8"?>
<s:Application xmlns:fx="http://ns.adobe.com/mxml/2009"
xmlns:s="library://ns.adobe.com/flex/spark"
xmlns:mx="library://ns.adobe.com/flex/mx" minWidth="955" minHeight="600"
xmlns:amcharts="http://www.amcharts.com/com_internal"
backgroundColor="#FFFFFF"
creationComplete="{generateChartData()}"
width="100%"
height="100%" >
<fx:Declarations>
<!-- 将非可视元素(例如服务、值对象)放在此处 -->
</fx:Declarations>
<fx:Script>
<![CDATA[
import com.amcharts.chartClasses.AmGraph;
import mx.collections.ArrayCollection;
[Bindable]private var chartData:ArrayCollection = new ArrayCollection();
// generate some random data, quite different range
private function generateChartData():void{
var firstDate:Date = new Date();
firstDate.setDate(firstDate.getDate() - 100);
for(var i:Number = 0; i < 100; i++){
var newDate:Date = new Date(firstDate);
newDate.setDate(newDate.getDate() + i);
var visits:Number = Math.round(Math.random() * 40) + 100;
var hits:Number = Math.round(Math.random() * 80) + 500;
var views:Number = Math.round(Math.random() * 6000);
chartData.addItem({date:newDate, visits:visits, hits:hits, views:views});
}
}
private function zoom():void{
chart.zoomToIndexes(0,20);
}
private var _newValueAxis:ValueAxis;
private function addValueAxis():void{
_newValueAxis = new ValueAxis();
_newValueAxis.offset = 50;
_newValueAxis.setStyle("gridAlpha", 0);
_newValueAxis.setStyle("axisColor", 0xB0DE09);
_newValueAxis.setStyle("axisThickness", 2);
chart.addValueAxis(_newValueAxis);
var graph:AmGraph = new AmGraph();
graph.valueField = "views";
graph.setStyle("bullet", "triangleUp");
graph.setStyle("hideBulletsCount", 30);
graph.type = "smoothedLine";
graph.valueAxis = _newValueAxis;
chart.addGraph(graph);
addAxis.enabled = false;
removeAxis.enabled = true;
}
private function removeValueAxis():void{
chart.removeValueAxis(_newValueAxis);
addAxis.enabled = true;
removeAxis.enabled = false;
}
]]>
</fx:Script>
<mx:VBox width="100%" height="100%">
<amcharts:AmSerialChart
dataUpdated="{zoom()}"
id="chart"
width="100%"
height="100%"
dataProvider="{chartData}"
categoryField="date">
<amcharts:graphs>
<!-- In case you have more then one value axis, you should set valueAxis for the graph -->
<amcharts:AmGraph title="Visits" valueAxis="{v1}" valueField="visits" type="smoothedLine" bullet="round" hideBulletsCount="30"/>
<amcharts:AmGraph title="Visits" valueAxis="{v2}" valueField="hits" type="smoothedLine" bullet="square" hideBulletsCount="30"/>
</amcharts:graphs>
<!-- you can have any number of value axes. If you place value axes on the same side, you can move axis by setting "offset" property -->
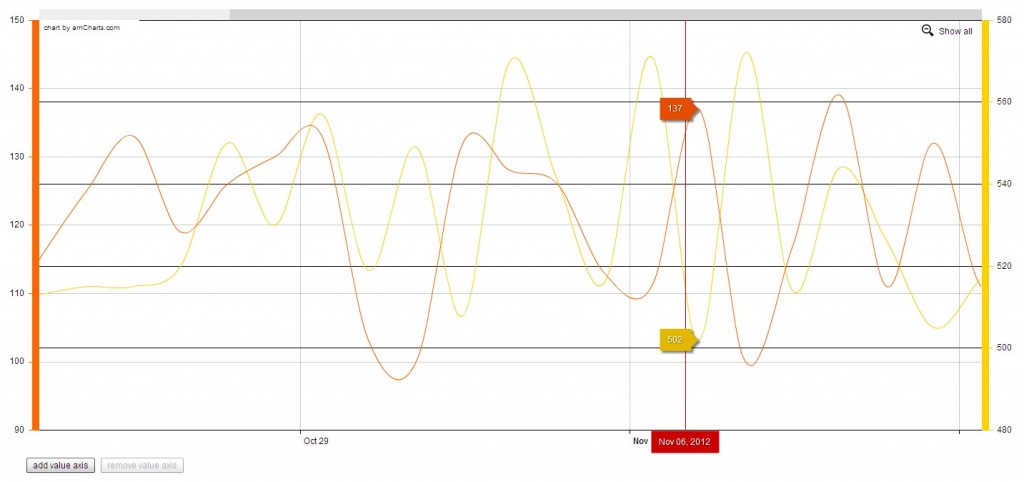
<amcharts:valueAxes>
<amcharts:ValueAxis id="v1" axisColor="#FF6600" title="ffff下行ffffffff" axisThickness="10"/>
<amcharts:ValueAxis id="v2" position="right" title="下行2ddddd" axisColor="#FCD202" gridAlpha="10" axisThickness="10"/>
</amcharts:valueAxes>
<amcharts:categoryAxis>
<amcharts:CategoryAxis parseDates="true" minPeriod="ss" gridCount="13"/>
</amcharts:categoryAxis>
<amcharts:chartCursor>
<amcharts:ChartCursor cursorPosition="mouse"/>
</amcharts:chartCursor>
<amcharts:chartScrollbar>
<amcharts:ChartScrollbar height="15"/>
</amcharts:chartScrollbar>
</amcharts:AmSerialChart>
<mx:HBox>
<mx:Spacer width="35"/>
<mx:Button id="addAxis" label="add value axis" click="{addValueAxis()}"/>
<mx:Button enabled="false" id="removeAxis" label="remove value axis" click="{removeValueAxis()}"/>
</mx:HBox>
<mx:Spacer height="15"/>
</mx:VBox>
</s:Application>
补充:.NET技术 , C#


