AnyChart图表控件使用指南(二)
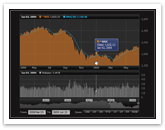
--------------------编程问答-------------------- 支持一下 --------------------编程问答-------------------- 好是好,但是加密很差 --------------------编程问答-------------------- 广告一个 --------------------编程问答-------------------- 你要的是不是这个?AnyChart股票和金融图表(简称:AnyStock)是一个基于XML/ JSON Flash的金融图表解决方案。AnyStock技术把你的实时数据变成具有交互功能的高度复杂的图表,把您的数据可视化呈现在网络上。设计用来显示数据和基于时间的信息,AnyStock是理想的用于客户报告和业绩报告应用的工具。报告和仪表板都带有滚动、摘取、平移和缩放功能的可视物。
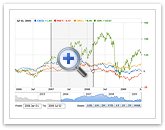
AnyChart提供多种金融图表类型和技术指标包括SMA,EMA,MACD,布林线和PSAR,指出的只是很少的部分。AnyChart把外汇分析,商品和投资市场数据带到生活。查看长期的、大量的数据的能力可以很容易的通过滚动、平移、缩放控制来实现。添加新闻事件(分析师的意见,内幕交易,股息和重要进展)提高你有效地分析信息的能力。
技术指标和覆盖
 --------------------编程问答--------------------
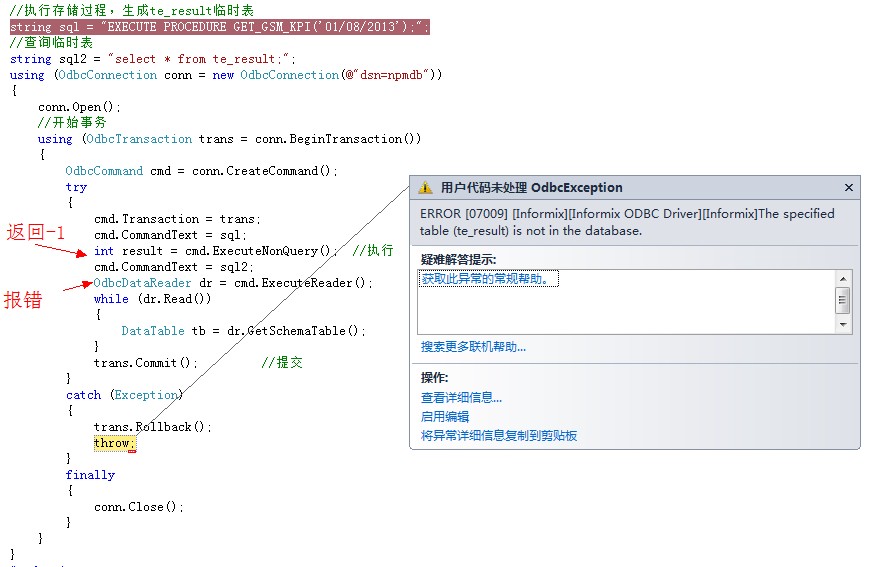
是不是自己得安装一些什么插件呢? 我的xml文件怎么显示不出来?
--------------------编程问答--------------------
是不是自己得安装一些什么插件呢? 我的xml文件怎么显示不出来?下面是我的xml代码
- <anychart>
- <settings>
<animation enabled="false" />
- <context_menu>
<save_as_image_item_text>保存为图片</save_as_image_item_text>
<save_as_pdf_item_text>保存为PDF</save_as_pdf_item_text>
</context_menu>
- <locale>
- <date_time_format>
- <months>
<names>January,February,March,April,May,June,July,August,September,October,November,December</names>
<short_names>Jan,Feb,Mar,Apr,May,Jun,Jul,Aug,Sep,Oct,Nov,Dec</short_names>
</months>
<time am_string="AM" short_am_string="A" pm_string="PM" short_pm_string="P" />
- <week_days start_from="Sunday">
<names>Sunday,Monday,Tuesday,Wednesday,Thursday,Friday,Saturday</names>
<short_names>Sun,Mon,Tue,Wed,Thu,Fri,Sat</short_names>
</week_days>
<format>%yyyy/%MM/%dd %HH:%mm</format>
</date_time_format>
</locale>
</settings>
- <charts>
+ <chart plot_type="Scatter">
- <chart_settings>
- <title>
<text>功图曲线</text>
</title>
- <axes>
- <x_axis>
<scale type="String" />
- <labels>
<format>{%Value}</format>
</labels>
- <title>
<text>位移(m)</text>
</title>
</x_axis>
- <y_axis>
- <title>
<text>载荷(KN)</text>
</title>
- <labels>
- <format>
- <![CDATA[ {%Value}{numDecimals:1}
]]>
</format>
</labels>
</y_axis>
</axes>
</chart_settings>
- <data_plot_settings>
- <line_series>
- <line_style>
<line thickness="3" />
<line color="#1D8BD1" />
</line_style>
<marker_settings enabled="false" />
- <tooltip_settings enabled="true">
<format>{%YValue}{numDecimals:1}KN</format>
</tooltip_settings>
</line_series>
</data_plot_settings>
- <data>
- <series name="Series" type="spLine">
<point x="0" y="0" />
</series>
- <series name="SeriesGG" type="spLine">
<point x="0" y="0" />
</series>
</data>
</chart>
</charts>
</anychart>
补充:.NET技术 , 图表区