MSCHART 饼状图怎样显示百分比?
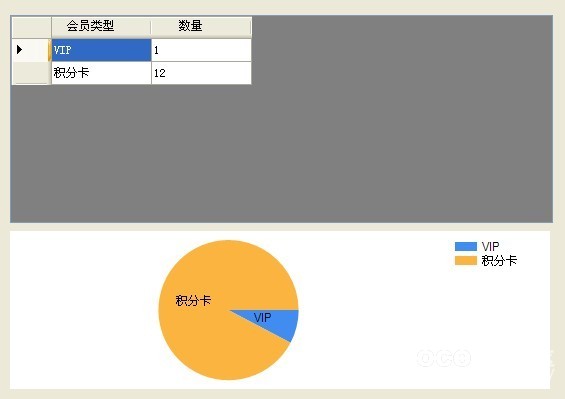
MSCHART 饼状图怎样显示百分比,我想在饼状图上显示出百分比??大家看我的代码写的对不对,第一次用MSCHART 网上好像也没找到例程..sql = " select tmm1102,count(tmm1200) as 数量 from tmm12 "
+ " left outer join tmm11 on tmm1100=tmm1201 "
+ " group by tmm1102 ";
DataSet dt = DBOperate.executeQueryDS(sql, "TMM12");
dataGridView1.DataSource = dt.Tables["TMM12"];
chart1.DataSource = dt.Tables["TMM12"];
chart1.Series["Series1"].XValueMember = "TMM1102";
chart1.Series["Series1"].YValueMembers = "数量";
chart1.DataBind();
 --------------------编程问答--------------------
没用过帮你顶下,不过你可以自己算出来的,在旁边或者留白的地方,自己算出输出
--------------------编程问答--------------------
--------------------编程问答--------------------
没用过帮你顶下,不过你可以自己算出来的,在旁边或者留白的地方,自己算出输出
--------------------编程问答--------------------
不过想在圆饼图上显示,这样更明了一些 --------------------编程问答-------------------- 来个人为小弟解答下吧~~ --------------------编程问答-------------------- 问题简单没人愿意回答吗..用的是VS2008.. --------------------编程问答-------------------- chart.DataSource = dt;
Series series = new Series("test");
series.ChartType = SeriesChartType.Pie;
series.IsValueShownAsLabel = true;
series.CustomProperties = "DoughnutRadius=25, PieDrawingStyle=Concave, CollectedLabel=Other, MinimumRelativePieSize=20";
series.Label = "#PERCENT{P1}"; series.BackGradientStyle = GradientStyle.None;
for (int i = 0; i < dt.Rows.Count; i++)
{
series.Points.AddXY(dt.Rows[i][0], dt.Rows[i][1].ToString());
series.Points[i].LegendText = dt.Rows[i][0].ToString();
}
chart.Series.Add(series);
// Set the threshold under which all points will be collected
series["CollectedThreshold"] = "8";
// Set the label of the collected pie slice
series["CollectedLabel"] = "Other";
// Set the legend text of the collected pie slice
series["CollectedLegendText"] = "Other";
// Set the collected pie slice to be exploded
series["CollectedSliceExploded"] = true.ToString();
--------------------编程问答-------------------- 我最近在弄Chart控件 不知道你这个控件里面有木有 series1.IsValueShownAsLabel = true;这个属性 有的话 你算出来 显示就可以了 --------------------编程问答--------------------
补充:.NET技术 , C#