zedgraph 曲线图问题!(Asp.net(C#))

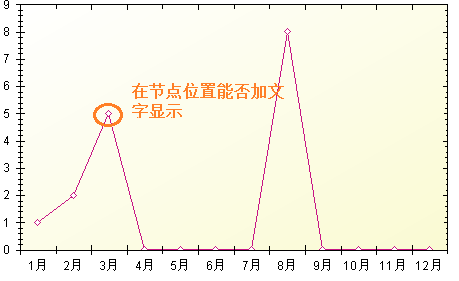
在节点位置能否动态添加文字,求大神大虾帮助! zedgraph 曲线图 --------------------编程问答--------------------
 看文档看demo呗
--------------------编程问答--------------------
都可以的吧,label
--------------------编程问答--------------------
自己顶一下,能贴点代码出来吗!大神
--------------------编程问答--------------------
大神在哪里啊!求关注啊
--------------------编程问答--------------------
此贴就这样结束了吗。哎!
--------------------编程问答--------------------
你只要在坐标处加一个DIV,DIV的position设置为absolute,设置DIV的onmouseover事件当鼠标滑过时显示文本就行了
--------------------编程问答--------------------
嗯,前几天查到的,可以用!
看文档看demo呗
--------------------编程问答--------------------
都可以的吧,label
--------------------编程问答--------------------
自己顶一下,能贴点代码出来吗!大神
--------------------编程问答--------------------
大神在哪里啊!求关注啊
--------------------编程问答--------------------
此贴就这样结束了吗。哎!
--------------------编程问答--------------------
你只要在坐标处加一个DIV,DIV的position设置为absolute,设置DIV的onmouseover事件当鼠标滑过时显示文本就行了
--------------------编程问答--------------------
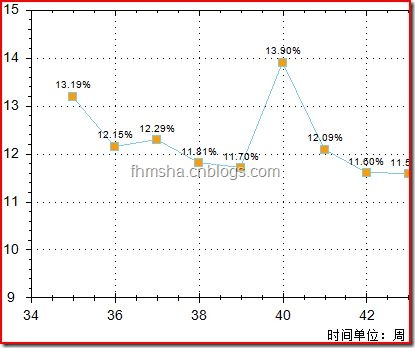
嗯,前几天查到的,可以用!int ord = 0;
foreach (CurveItem mycurve in GraphPanetemp.GraphPane.CurveList)
{
LineItem line = mycurve as LineItem;
if (line == DTRate) //DTRate为图中的一条线
{
IPointList points = mycurve.Points;
for (int i = 0; i < points.Count; i++)
{
double xVal = points[i].X;
double yVal = points[i].Y;
string lab = yVal.ToString("0.000") + "%";
TextObj text = new TextObj(lab, (float)xVal+1, (float)yVal * 1.01); //位置偏移调节
text.Location.CoordinateFrame = CoordType.AxisXYScale;
text.FontSpec.Size = 10;
text.Location.AlignH = AlignH.Center;
text.Location.AlignV = AlignV.Bottom;
text.FontSpec.Border.IsVisible = false;
text.FontSpec.Angle = 0;
text.FontSpec.Fill.IsVisible = false;
GraphPanetemp.GraphPane.GraphObjList.Add(text);
}
}
ord++;
}
注意:
1.在ZedGraph早期的版本中TextObj的名称为TextItem
2.画图的masterPane.AxisChange(g);语句在早期版本中为base.ZedGraphControl.AxisChange();
3.curve.Points在现在的版本类型为IPointList ,早期为PointPairList
4.本代码中(float)yVal*1.01是为是产生一个向上的偏移,由于不知道Y轴的具体高度,如果用强位移的话会因Y轴刻度过短而达不到偏移效果。

补充:.NET技术 , ASP.NET


