jsGantt(甘特图控件)
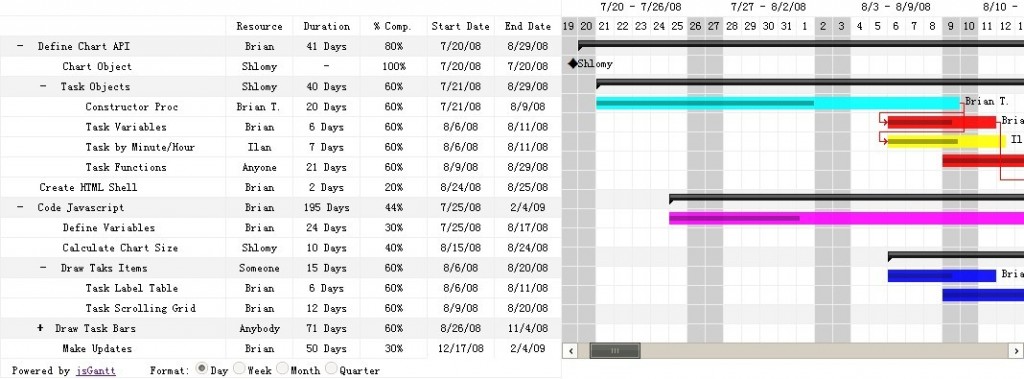
jsGantt是一个基于Javascript/CSS/HTML实现的甘特图控件。可以对任务进行分组、设置任务依赖、不同任务用不同颜标识、设置里程碑。支持动态加载任务,按天、周、月、小时、分钟查看任务甘特图。

TaskItem(pID, pName, pStart, pEnd, pColor, pLink, pMile, pRes, pComp, pGroup, pParent, pOpen, pDepend)
pID: (required) is a unique ID used to identify each row for parent functions and for setting dom id for hiding/showing
pName: (required) is the task Label
pStart: (required) the task start date, can enter empty date ('') for groups. You can also enter specific time (2/10/2008 12:00) for additional percision or half days.
pEnd: (required) the task end date, can enter empty date ('') for groups
pColor: (required) the html color for this task; e.g. '00ff00'
pLink: (optional) any http link navigated to when task bar is clicked.
pMile:(optional) represent a milestone
pRes: (optional) resource name
pComp: (required) completion percent
pGroup: (optional) indicates whether this is a group(parent) - 0=NOT Parent; 1=IS Parent
pParent: (required) identifies a parent pID, this causes this task to be a child of identified task
pOpen: can be initially set to close folder when chart is first drawn
pDepend: optional list of id's this task is dependent on ... line drawn from dependent to this item
pCaption: optional caption that will be added after task bar if CaptionType set to "Caption"
*You should be able to add items to the chart in realtime via javascript and issuing "g.Draw()" command.
JSGantt.parseXML("project.xml",g);
[html]
<project>
<task>
<pID>10</pID>
<pName>WCF Changes</pName>
<pStart></pStart>
<pEnd></pEnd>
<pColor>0000ff</pColor>
<pLink></pLink>
<pMile>0</pMile>
<pRes></pRes>
<pComp>0</pComp>
<pGroup>1</pGroup>
<pParent>0</pParent>
<pOpen>1</pOpen>
<pDepend />
</task>
<task>
<pID>20</pID>
<pName>Move to WCF from remoting</pName>
<pStart>8/11/2008</pStart>
<pEnd>8/15/2008</pEnd>
<pColor>0000ff</pColor>
<pLink></pLink>
<pMile>0</pMile>
<pRes>Rich</pRes>
<pComp>10</pComp>
<pGroup>0</pGroup>
<pParent>10</pParent>
<pOpen>1</pOpen>
<pDepend></pDepend>
</task>
<task>
<pID>30</pID>
<pName>add Auditing</pName>
<pStart>8/19/2008</pStart>
<pEnd>8/21/2008</pEnd>
<pColor>0000ff</pColor>
<pLink></pLink>
<pMile>0</pMile>
<pRes>Mal</pRes>
<pComp>50</pComp>
<pGroup>0</pGroup>
<pParent>10</pParent>
<pOpen>1</pOpen>
<pDepend>20</pDepend>
</task>
</project>
Final code should look like
[html]
<link rel="stylesheet" type="text/css" href="jsgantt.css" />
<script language="javascript" src="jsgantt.js"></script>
<div style="position:relative" class="gantt" id="GanttChartDIV"></div>
<script>
var g = new JSGantt.GanttChart('g',document.getElementById('GanttChartDIV'), 'day');
g.setShowRes(1); // Show/Hide Responsible (0/1)
g.setShowDur(1); // Show/Hide Duration (0/1)
g.setShowComp(1); // Show/Hide % Complete(0/1)
g.setCaptionType('Resource'); // Set to Show Caption
if( g ) {
g.AddTaskItem(new JSGantt.TaskItem(1, 'Define Chart API', '', '', 'ff0000', 'http://help.com', 0, 'Brian', 0, 1, 0, 1));
g.AddTaskItem(new JSGantt.TaskItem(11, 'Chart Object', '2/20/2008', '2/20/2008', 'ff00ff', 'http://www.yahoo.com', 1, 'Shlomy', 100, 0, 1, 1));
g.AddTaskItem(new JSGantt.TaskItem(12, 'Task Objects', '', '', '00ff00', '', 0, 'Shlomy', 40, 1, 1, 1));
g.AddTaskItem(new JSGantt.TaskItem(121, 'Constructor Proc', '2/21/2008', '3/9/2008', '00ffff', 'http://www.yahoo.com', 0, 'Brian T.', 60, 0, 12, 1));
g.AddTaskItem(new JSGantt.TaskItem(122, 'Task Variables', '3/6/2008', '3/11/2008', 'ff0000', 'http://help.com', 0, '', 60, 0, 12, 1,121));
g.AddTaskItem(new JSGantt.TaskItem(123, 'Task Functions', '3/9/2008', '3/29/2008', 'ff0000', 'http://help.com', 0, 'Anyone', 60, 0, 12, 1, 0, 'This is another caption'));
g.AddTaskItem(new JSGantt.TaskItem(2, 'Create HTML Shell', '3/24/2008', '3/25/2008', 'ffff00', 'http://help.com', 0, 'Brian', 20, 0, 0, 1,122));
g.AddTaskItem(new JSGantt.TaskItem(3, 'Code Javascript', '', '', 'ff0000', 'http://help.com', 0, 'Brian', 0, 1, 0, 1 ));
g.AddTaskItem(new JSGantt.TaskItem(31, 'Define Variables', '2/25/2008', '3/17/2008', 'ff00ff', 'http://help.co
补充:软件开发 , Java ,


