mschart x轴显示问题
mschart 我在使用的时候是一个点对应一个x轴和y轴值的数据,但是我0点到1点之间有五个数据点正常显示是绑定数据后五个点的时间都会显示在x轴上,然后我1点到2点有8个数据,数据点的每个时间都会显示在x轴上,如何设备成x轴只显示0 1 2 这样整点的x轴,每个时间内可以显示多个数据点但不显示在x轴上 --------------------编程问答-------------------- 设置X轴标签的间隔类型为小时。 --------------------编程问答--------------------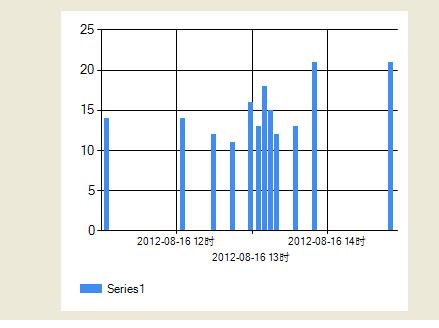
--------------------编程问答--------------------
 chart1.ChartAreas[0].AxisX.LabelStyle.Format = @"{yyyy-MM-dd HH时}";

 chart1.ChartAreas[0].AxisX.IntervalType = DateTimeIntervalType.Hours;

 chart1.ChartAreas[0].AxisX.Interval = 1;
老兄你的图片怎么插入的 --------------------编程问答-------------------- 先上传到CSDN的相册,获取链接,就可以了。 --------------------编程问答--------------------
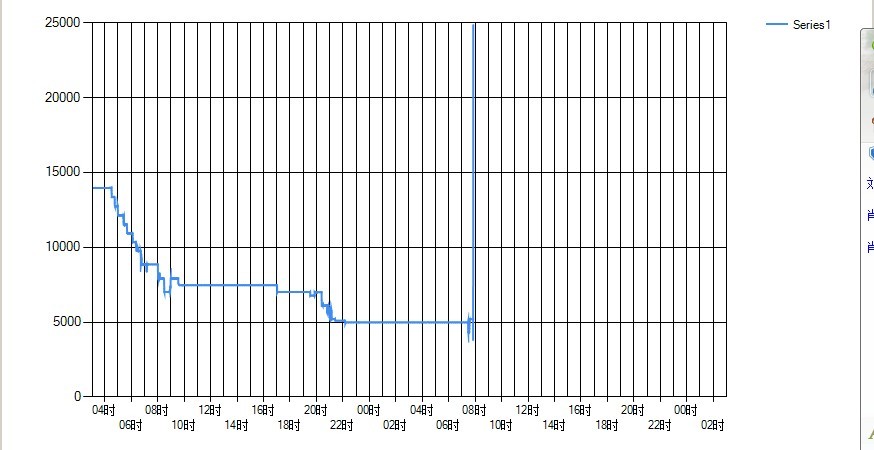
还有个问题,我照你说的设置了,效果很好。但是出现另一个问题,请教下,
图片上是我查询四点到八点的数据,为什么八点以后没有数据也显示网格了,我没有设置什么,然后我查询三点到五点的也是后面会多出这些网格 --------------------编程问答--------------------
 --------------------编程问答--------------------
这个要看你的X轴给定的数据,如果只到8点,那后面是不会出现网格的(空数据)。
--------------------编程问答--------------------
这个要看你的X轴给定的数据,如果只到8点,那后面是不会出现网格的(空数据)。--------------------编程问答--------------------
给定的数据就是八点,然后我不管选择几点他都有这么多条x轴竖线, --------------------编程问答-------------------- 给出你创建 Chart的所有代码,包括格式化和配置。用在ASP.NET还是WINFORM? --------------------编程问答--------------------
winform
using System;
using System.Collections.Generic;
using System.ComponentModel;
using System.Data;
using System.Drawing;
using System.Linq;
using System.Text;
using System.Windows.Forms;
using System.Windows.Forms.DataVisualization.Charting;
using System.Data.SqlClient;
namespace 图表_1
{
public partial class Form1 : Form
{
public Form1()
{
InitializeComponent();
}
// public string ()
private void Form1_Load(object sender, EventArgs e)
{
//ChartArea chartArea2 = new ChartArea();
//chartArea2.AxisX.IntervalAutoMode = IntervalAutoMode.VariableCount;
//Legend legend2 = new Legend();
//Series series2 = new Series();
// series2.IsXValueIndexed = true;
this.chart1.Series[0].ChartType = SeriesChartType.Spline;
//chart1.ChartAreas[0].AxisX.Interval =1;
//chart1.ChartAreas[0].AxisX.IntervalOffset = 2;
chart1.ChartAreas[0].AxisX.LabelStyle.Format = @"{HH时}";
  chart1.ChartAreas[0].AxisX.IntervalType = DateTimeIntervalType.Days;

  //chart1.ChartAreas[0].AxisX.IsLabelAutoFit = true;

  chart1.ChartAreas[0].AxisX.Interval = 2;
//chart1.ChartAreas[0].AxisX.MajorGrid.Interval = 1;
//chart1.ChartAreas[0].AxisX.LabelStyle.IsStaggered = true;
//chartArea2.Name = "ChartArea1";
//chart1.ChartAreas.Add(chartArea2);
//legend2.Name = "Legend1";
//chart1.Legends.Add(legend2);
//chart1.Location = new System.Drawing.Point(10, 75);
//chart1.Name = "img_reptype";
//series2.Legend = "Legend1";
//series2.Name = "Series1";
//chart1.Series.Add(series2);
//chart1.Size = new System.Drawing.Size(600, 400);
//chart1.TabIndex = 1;
//chart1.Text = "chart1";
//double[] yval = { 2, 6, 4, 5, 3, 2, 5, 6, 3, 2, 5, 6 };
//string[] xval = { "Peter", "Andrew", "Julie", "Mary", "Dave", "a", "b", "c", "dd", "ee", "ff", "sf" };
//Bind the double array to the Y axis points of the Default dataseries
//chart1.Series["Series1"].Points.DataBindXY(xval, yval);
}
public DateTime datebasetime;
bool IfTimeCheck(string x,string y)
{
x = x.Replace("/", "");
y = y.Replace("/", "");
int x1 = Convert.ToInt32(x);
int y1 = Convert.ToInt32(y);
if (x1 > y1)
{
return false;
}
else
{
return true;
}
}
private void button1_Click(object sender, EventArgs e)
{
dataGridView1.Rows.Clear();
chart1.Series["Series1"].Points.Clear();
string startttimeday = dateTimePicker1.Value.ToShortDateString();
string starttimemm = comboBox1.Text;
if (comboBox1 .Text =="" )
{
starttimemm = "00";
}
string starttime = startttimeday + " " + starttimemm + ":00" + ":00";
string endtimeday = dateTimePicker2.Value.ToShortDateString();
string endtimemm = comboBox2.Text;
if (comboBox2.Text == "")
{
endtimemm = "00";
}
bool iftun= IfTimeCheck(startttimeday ,endtimeday);
if (iftun == false)
{
MessageBox.Show("开始时间比结束时间要大,请重新选择");
return;
}
string endtime = endtimeday + " " + endtimemm + ":00" + ":00";
string strsql = "select deviceid,time,alarm,velocity,wl_loadmile,oilcur from dyndata where [time] between @starttime and @endtime and deviceid='3046729849' order by [time]";
string consts = "Data Source=(local);Initial Catalog=usersystemoil;User ID=sa;Password=sa;";
using (SqlConnection con = new SqlConnection(consts))
{
using (SqlCommand cmd = con.CreateCommand())
{
cmd.CommandText = strsql;
cmd.Parameters.Add("@starttime", starttime);
cmd.Parameters.Add("@endtime", endtime);
SqlDataAdapter myada = new SqlDataAdapter();
myada.SelectCommand = cmd;
DataSet ds=new DataSet ();
myada.Fill(ds);
DataTable tb1 = ds.Tables[0];
foreach (DataRow dr in tb1 .Rows )
{
string devi= dr[0].ToString();
string ti=dr[1].ToString();
datebasetime = Convert .ToDateTime( ti);
string alar=dr[2].ToString();
int l=Convert .ToInt32(alar );
string zt;
if(1>0)
{
zt="报警";
}
else
{
zt="正常行驶";
}
string velo=dr[3].ToString();
string mile=dr[4].ToString();
string oil= dr[5].ToString();
if (oil == "")
{
return;
}
int x = oil.Length;
string oili = oil.Substring(0, x - 2);
chart1.Series["Series1"].Points.AddXY(datebasetime , oil);
dataGridView1.Rows.Add(devi ,ti,velo ,mile,oil,zt);
}
}
}
}
}
}
Form Designer 加载Chart 代码,vs2010
// chart1
//
chartArea1.Name = "ChartArea1";
this.chart1.ChartAreas.Add(chartArea1);
legend1.Name = "Legend1";
this.chart1.Legends.Add(legend1);
this.chart1.Location = new System.Drawing.Point(3, 32);
this.chart1.Name = "chart1";
series1.ChartArea = "ChartArea1";
series1.Legend = "Legend1";
series1.Name = "Series1";
this.chart1.Series.Add(series1);
this.chart1.Size = new System.Drawing.Size(870, 454);
this.chart1.TabIndex = 12;
this.chart1.Text = "chart1";
//
// Form1 --------------------编程问答--------------------
chart1.ChartAreas[0].AxisX.IntervalType = DateTimeIntervalType.Days;
//chart1.ChartAreas[0].AxisX.IsLabelAutoFit = true;
chart1.ChartAreas[0].AxisX.Interval = 2;
---------------------------------
应该是这里出问题,间隔类型的天,间隔是2天,所以界面出现2天内的范围! --------------------编程问答--------------------
改成hours 也是一样的 --------------------编程问答-------------------- 那你恢复回去,
用2个一维数组,伪造的测试数据,一一对应的时间和值,绑定到图表中,看下效果。
补充:.NET技术 , 图表区