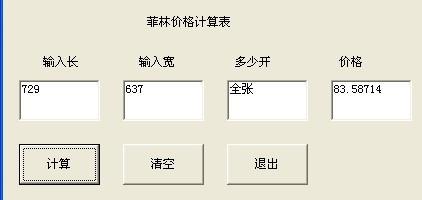
将计算结果,用柱状图表示出来 如何实现
Private Sub Command1_Click()Text5 = Format(Val(Text4) * 196.72 * 35588 / 32909, "0")
Text6 = Format((Val(Text1) + Val(Text3)) * 1000 * 0.404 * 0.722 * 0.998 * 44 / 12 + Val(Text2) * 56, "0")
Text7 = Format(196.72 * Val(Text4) * 35588 / 32909 * 1064 / 1000, "0")
Text10 = Format((Val(Text1) + Val(Text3)) * 1000 * 0.404 * 0.9 * 0.0112 * 2 / 0.7143, "0")
Text11 = Format(196.72 * Val(Text4) * 35588 / 32909 * 0.857 / 1000, "0")
Text14 = Format((Val(Text1) + Val(Text3)) * 1000 * 0.0033 + Val(Text2) * 0.125, "0")
Text15 = Format(196.72 * Val(Text4) * 35588 / 32909 * 1.8 / 1000, "0")
Text18 = Format((Val(Text1) + Val(Text3)) * 1000 * 0.000036, "0")
Text8 = Format(Val(Text6) - Val(Text7), "0")
Text12 = Format(Val(Text10) - Val(Text11), "0")
Text16 = Format(Val(Text14) - Val(Text15), "0")
Text20 = Format(Val(Text18), "0")
Text9 = Format(Val(Text8) / Val(Text6), "0%")
Text13 = Format(Val(Text12) / Val(Text10), "0%")
Text17 = Format(Val(Text16) / Val(Text14), "0%")
Text21 = Format(Val(Text20) / Val(Text18), "0%")
End Sub
Private Sub Command2_Click()
Text1 = ""
Text2 = ""
Text3 = ""
Text4 = ""
Text5 = ""
Text6 = ""
Text7 = ""
Text8 = ""
Text9 = ""
Text10 = ""
Text11 = ""
Text12 = ""
Text13 = ""
Text14 = ""
Text15 = ""
Text16 = ""
Text17 = ""
Text18 = ""
Text19 = ""
Text20 = ""
Text21 = ""
End Sub
Private Sub Command3_Click()
End
End Sub
其中将text6和text7,text10和text11,text14和text15,text18分别表示在四个柱状图中,四个控件的标题分别为二氧化碳排放量、二氧化硫排放量、氮氧化合物排放量、粉尘排放量,并且四个控件在同一个窗体中。另外,添加一个Command4按钮,其功能是:计算完成后,点击它,就可以直接出图。
希望易做图给与帮助,谢谢,下周就要答辩了!谢谢
--------------------编程问答-------------------- 我做的考试系统也有柱状图显示
就是将成绩的及格率、优秀率,各分数段人数用柱状图显示
我做了两天了,没做出来
希望高手能给与指点
补充:VB , 基础类


