JFreeChart画柱状图,数据过多导致横轴标签显示为"...",悬赏100急求完美解决!
我用的是CategoryDataset类型的,且每根柱子的标签为String类型的,试过很多方法,比如把横轴的标签竖着或者斜着或者换行显示,但是因为生成的图大小必须固定所以当数据过多时还是不能正常显示,想到的解决办法是能不能根据数据的多少自动设置横轴的标签,比如,如果数据很少,就每根柱子下都有标签;如果数据过多不能完全显示标签时,就每隔若干根柱子才显示一次标签,比如下图的显示效果: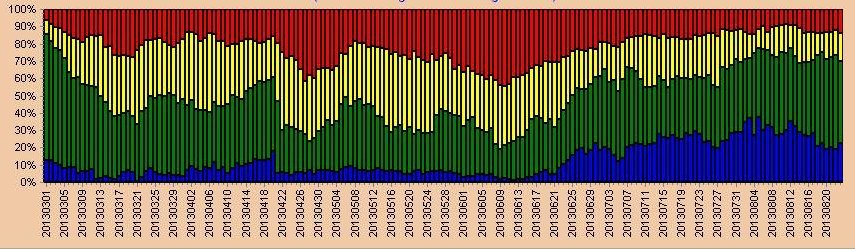
只要解决马上那个结帖,小弟在这谢谢各位大神了!!! jfreechart --------------------编程问答--------------------
 JFreeChart没用过,顶一下
--------------------编程问答--------------------
谢谢支持!!!!
--------------------编程问答--------------------
额,我是点击后将图片放大到另一个页面显示,或者加上滚动条将图片放大显示 反正那么多数据挤在那里肯定不能完全显示
--------------------编程问答--------------------
这个没办法,jfreeChart没有自适应的功能,数据多了就会显示....
--------------------编程问答--------------------
JFreeChart没用过,顶一下
--------------------编程问答--------------------
谢谢支持!!!!
--------------------编程问答--------------------
额,我是点击后将图片放大到另一个页面显示,或者加上滚动条将图片放大显示 反正那么多数据挤在那里肯定不能完全显示
--------------------编程问答--------------------
这个没办法,jfreeChart没有自适应的功能,数据多了就会显示....
--------------------编程问答--------------------
/**--------------------编程问答-------------------- 动态获取,分次显示
* 柱状图
* @param dataset
* @param plot
* @param width
* @param height
* @throws Exception
*/
public void pillar(DefaultCategoryDataset dataset, PlotOrientation plot, Integer width, Integer height) throws Exception {
JFreeChart chart = ChartFactory.createBarChart3D("", "", "", dataset, plot, true, true, true);
CategoryPlot plot1 = chart.getCategoryPlot();//获得图表区域对象
BarRenderer3D bar = (BarRenderer3D) plot1.getRenderer();
bar.setBaseItemLabelGenerator(new StandardCategoryItemLabelGenerator());//显示每个柱的数值
bar.setBaseItemLabelsVisible(true);
bar.setBasePositiveItemLabelPosition(new ItemLabelPosition(ItemLabelAnchor.OUTSIDE12, TextAnchor.BASELINE_CENTER));
bar.setItemLabelAnchorOffset(-12D);// 设置柱形图上的文字偏离值
if (height == 35) {
height = 135;
bar.setMaximumBarWidth(0.25);
bar.setItemMargin(0.000000005);
}
plot1.setRenderer(bar);
try {
NumberAxis axis = (NumberAxis) plot1.getRangeAxis();// y轴精度
axis.setAutoRangeIncludesZero(true);// 设置刻度必须从0开始
axis.setNumberFormatOverride(new DecimalFormat("#0"));
} catch (Exception e) {}
getResponse().setContentType("text/plain;charset=UTF-8");
ChartUtilities.writeChartAsPNG(getResponse().getOutputStream(), chart, width, height);
}
/**
* 折线图
* @param dataset
* @param plot
* @param width
* @param height
* @throws Exception
*/
public void line(DefaultCategoryDataset dataset, PlotOrientation plot, Integer width, Integer height) throws Exception {
JFreeChart chart = ChartFactory.createLineChart("", "", "", dataset, plot, true, true, true);
CategoryPlot plot1 = chart.getCategoryPlot();//获得图表区域对象
LineAndShapeRenderer renderer = new LineAndShapeRenderer();
//renderer.setSeriesPaint(0, Color.BLUE);// 改变折线的颜色
renderer.setBaseItemLabelGenerator(new StandardCategoryItemLabelGenerator());//显示每个柱的数值
renderer.setBaseItemLabelsVisible(true);
renderer.setBasePositiveItemLabelPosition(new ItemLabelPosition(ItemLabelAnchor.OUTSIDE12, TextAnchor.BASELINE_CENTER));
renderer.setItemLabelAnchorOffset(2D);// 设置柱形图上的文字偏离值
if (height == 35) {
height = 135;
}
plot1.setRenderer(renderer);// 给折线加点
try {
NumberAxis axis = (NumberAxis) plot1.getRangeAxis();// y轴精度
axis.setAutoRangeIncludesZero(true);// 设置刻度必须从0开始
axis.setNumberFormatOverride(new DecimalFormat("#0"));
} catch (Exception e) {}
getResponse().setContentType("text/plain;charset=UTF-8");
ChartUtilities.writeChartAsPNG(getResponse().getOutputStream(), chart, width, height);
}
/**
* 饼图
* @param dataset
* @param width
* @param height
* @throws Exception
*/
public void round(DefaultPieDataset dataset, Integer width, Integer height) throws Exception {
JFreeChart chart = ChartFactory.createPieChart("", dataset, true, true, true);
PiePlot plot = (PiePlot) chart.getPlot();
plot.setLabelLinkMargin(0.1d);
plot.setLabelGenerator(new StandardPieSectionLabelGenerator("{2}", new DecimalFormat("0.00"), new DecimalFormat("0.00%")));
getResponse().setContentType("text/plain;charset=UTF-8");
ChartUtilities.writeChartAsPNG(getResponse().getOutputStream(), chart, width, height);
}
补充:Java , Web 开发