oracle tkprof工具详解
oracle tkprof工具详解 今天是2013-09-26,进行tkprof工具使用学习,在此记录一下笔记:
一)查看需要跟踪会话信息:

select s.sid,s.serial#,s.username,s.logon_time,s.osuser,(select sys_context('userenv','ip_address') from dual) as ipa,
s.machine,p.username,p.program,p.spid
   from v$session s,v$process p
     where s.paddr=p.addr and s.username='SCOTT';

二)对会话开启sql trace功能:
[html]
SQL> begin
  2    dbms_system.set_int_param_in_session(47,43,'max_dump_file_size',10485760);
  3
  4    dbms_system.set_bool_param_in_session(47,43,'timed_statistics',true);
  5    dbms_system.set_sql_trace_in_session(47,43,true);
  6  end;
  7  /

PL/SQL procedure successfully completed.

SQL> begin
  2  dbms_system.set_sql_trace_in_session(47,43,false);
  3  end;
  4  /

PL/SQL procedure successfully completed.

SQL>


3)tkprof工具介绍:
[oracle@oracle-one trace]$ tkprof
Usage: tkprof tracefile outputfile [explain= ] [table= ]
              [print= ] [insert= ] [sys= ] [sort= ]
  table=schema.tablename   Use 'schema.tablename' with 'explain=' option.
  explain=user/password    Connect to ORACLE and issue EXPLAIN PLAN.
  print=integer    List only the first 'integer' SQL statements.
  aggregate=yes|no
  insert=filename  List SQL statements and data inside INSERT statements.
  sys=no           TKPROF does not list SQL statements run as user SYS.
  record=filename  Record non-recursive statements found in the trace file.
  waits=yes|no     Record summary for any wait events found in the trace file.
  sort=option      Set of zero or more of the following sort options:
    prscnt  number of times parse was called
    prscpu  cpu time parsing
    prsela  elapsed time parsing
    prsdsk  number of disk reads during parse
    prsqry  number of buffers for consistent read during parse
    prscu   number of buffers for current read during parse
    prsmis  number of misses in library cache during parse
    execnt  number of execute was called
    execpu  cpu time spent executing
    exeela  elapsed time executing
    exedsk  number of disk reads during execute
    exeqry  number of buffers for consistent read during execute
    execu   number of buffers for current read during execute
    exerow  number of rows processed during execute
    exemis  number of library cache misses during execute
    fchcnt  number of times fetch was called
    fchcpu  cpu time spent fetching
    fchela  elapsed time fetching
    fchdsk  number of disk reads during fetch
    fchqry  number of buffers for consistent read during fetch
    fchcu   number of buffers for current read during fetch
    fchrow  number of rows fetched
    userid  userid of user that parsed the cursor

[oracle@oracle-one trace]$
tracefile:就是跟着的tracefile名字
outputfile:就是把格式化之后的信息存入一个新的文件中
table:每次解析执行sql过程的时候会在数据库自动创建一个表,执行完后自动删除,也可以手动创建一个 表,然把信息存入该表中
这个表的结构需要和utlxplan.sql文件中表的结构一样。当执行完后该表信息被清空。
explain:使用哪个用户对sql进行解析
print:打印出integer个sql,可以和sort联合使用,打印出指定sort序列的几个sql
例如我可以找去消耗cpu最多的sql等等。
sort:按照要求进行排序,排序种类如下:
    prscnt  number of times parse was called
    prscpu  cpu time parsing
    prsela  elapsed time parsing
    prsdsk  number of disk reads during parse
    prsqry  number of buffers for consistent read during parse
    prscu   number of buffers for current read during parse
    prsmis  number of misses in library cache during parse
    execnt  number of execute was called
    execpu  cpu time spent executing
    exeela  elapsed time executing
    exedsk  number of disk reads during execute
    exeqry  number of buffers for consistent read during execute
    execu   number of buffers for current read during execute
    exerow  number of rows processed during execute
    exemis  number of library cache misses during execute
    fchcnt  number of times fetch was called
    fchcpu  cpu time spent fetching
    fchela  elapsed time fetching
    fchdsk  number of disk reads during fetch
    fchqry  number of buffers for consistent read during fetch
    fchcu   number of buffers for current read during fetch
    fchrow  number of rows fetched
    userid  userid of user that parsed the cursor
sys:在进行sql运行的时候,或出现递归查询,设置sys为no则忽略这些recursive sql,设置为yes则在执行计划中包括这些recursive sql
aggregate:对sql的运行情况进行统计
waits:显示wait event的概要信息
insert:把执行计划都生成一个sql文件,使用这个sql可以创建sql的整个过程。
record:创建一个包含客户端发出的所有sql的脚本文件,并不包括recursive sql,
可以通过该参数查看客户端程序是怎么运行的,整个运行sql的过程顺序是什么样的。
四)tkprof工具使用案例:
案例一:
eg:

[html]
[oracle@oracle-one trace]$ tkprof RHYS_ora_3191.trc sql_explain.txt sys=no explain=scott/root aggregate=yes record=sql_path.txt waits=yes

TKPROF: Release 11.2.0.4.0 - Development on Thu Sep 26 22:37:26 2013

Copyright (c) 1982, 2011, Oracle and/or its affiliates.  All rights reserved.


[oracle@oracle-one trace]$
[oracle@oracle-one trace]$ more sql_explain.txt

TKPROF: Release 11.2.0.4.0 - Development on Thu Sep 26 22:37:26 2013

Copyright (c) 1982, 2011, Oracle and/or its affiliates.  All rights reserved.

Trace file: RHYS_ora_3191.trc
Sort options: default

********************************************************************************
count    = number of times OCI procedure was executed
cpu      = cpu time in seconds executing
elapsed  = elapsed time in seconds executing
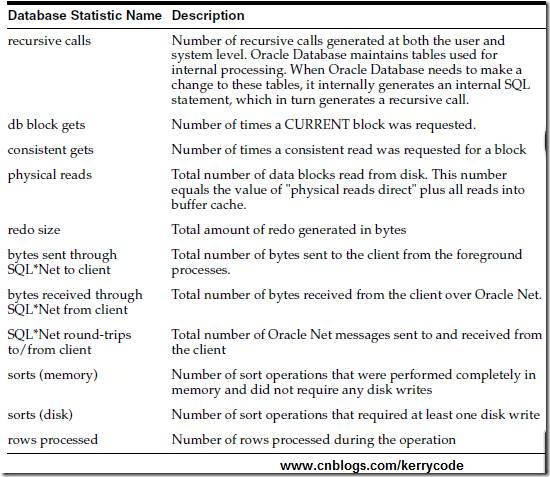
disk     = number of physical reads of buffers from disk
query    = number of buffers gotten for consistent read
current  = number of buffers gotten in current mode (usually for update)
rows     = number of rows processed by the fetch or execute call
********************************************************************************

The following statement encountered a error during parse:

select * from rhys.amy_dept
PARSE #1399268
Error encountered: ORA-00942
********************************************************************************

SQL ID: 9m7787camwh4m Plan Hash: 0

begin :id := sys.dbms_transaction.local_transaction_id; end;


call     count       cpu    elapsed       disk      query    current        rows
------- ------  -------- ---------- ---------- ---------- ----------  ----------
Parse        5      0.00       0.00          0          0          0           0
Execute      6      0.00       0.00          0          0          0           6
Fetch        0      0.00       0.00          0          0          0           0
------- ------  -------- ---------- ---------- ---------- ----------  ----------
total       11      0.00       0.00          0          0          0           6

Misses in library cache during parse: 0
Optimizer mode: ALL_ROWS
Parsing user id: 83  (SCOTT)
********************************************************************************

SQL ID: cf06fwacdmgfk Plan Hash: 1388734953

select 'x'
from
 dual


call     count       cpu    elapsed       disk      query    current        rows
------- ------  -------- ---------- ---------- ---------- ----------  ----------
Parse        3      0.00       0.00          0          0          0           0
Execute      3      0.00       0.00          0          0          0           0
Fetch        3      0.00       0.00          0          0          0           3
------- ------  -------- ---------- ---------- ---------- ----------  ----------
total        9      0.00       0.00          0          0          0           3

Misses in library cache during parse: 1
Optimizer mode: ALL_ROWS
Parsing user id: 83  (SCOTT)
Numbe- 更多Oracle疑问解答:
- 运行exp备份oracle数据库提示oracle-12154错误
- 有没有,生产Oracle Rman 备份脚本的工具啊!
- 初学orcle,希望有大大帮忙解说一下详细步骤,从登录oracle到创建表的过程
- oracle语句问题:一张user表,三个字段,id,name,time,插入记录比如:张三2007,李四2008,张三2011
- 如何写一个ORACLE触发器同步两个表中的数据?
- oracle 如何查看一个服务器上有多少个数据库.
- oracle 创建包的时候错误 求解
- oracle 重复列的问题
- oracle 中如何查处2星期前的数据
- 请教oracle数据库安装中的问题
- 请问谁能提供给我标准的oracle ERP的数据库表结构并详细说明各表主要的作用?
- 安装oracle遇到的问题 invalid entry CRC (expected 0x3e12e795 but got 0x9db0e9fd)
- 我的是ORACLE 10G,在RMAN中如何按指定的时间恢复数据文件啊?
- oracle为什么没有自动增长列
- oracle快捷键都有哪些啊?


